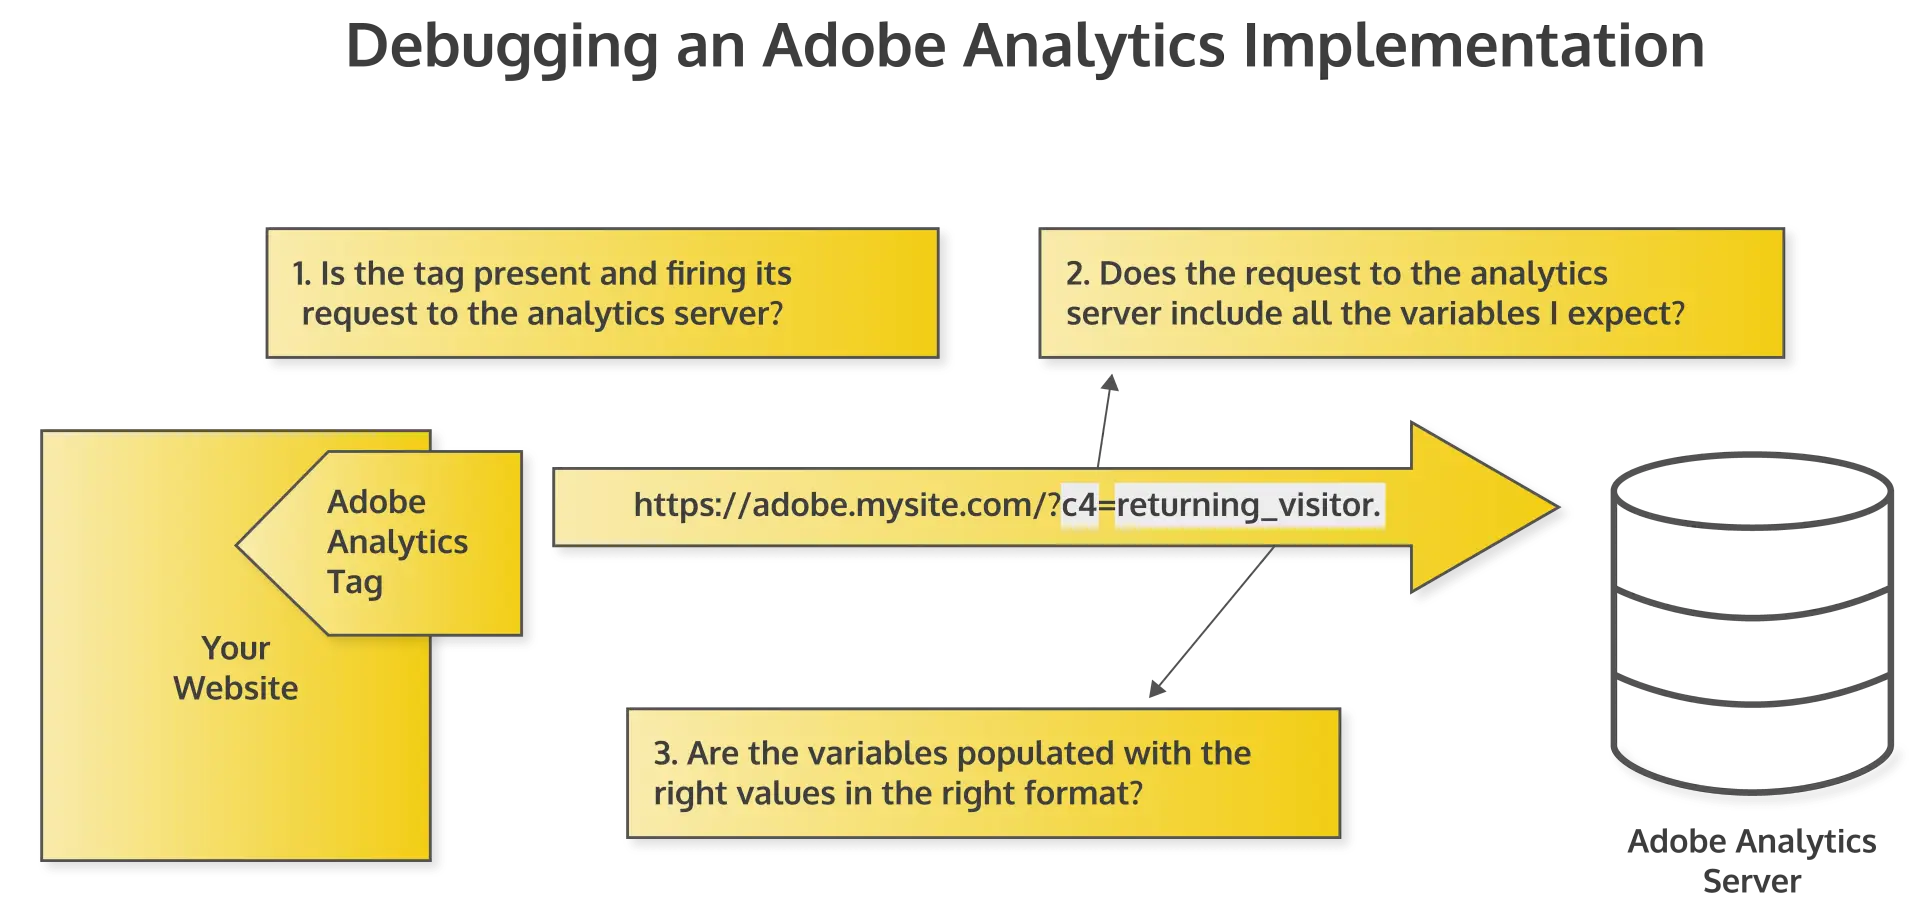
The goal of debugging an Adobe Analytics implementation is to verify your tags are firing as expected on any given page.
Specifically, you’re trying to answer the following questions:
- Is the Adobe Analytics tag present and firing off its request to the analytics server?
- Does the request to the analytics server include all the variables I expect?
- Are the variables populated with the right values in the right format?

Below are three ways you can debug your Adobe Analytics implementation, listed in order of most manual to least:
- Checking network requests with the developer tools
- Using an Adobe Analytics debugger
- Conducting an automated Adobe Analytics audit
 1. Checking network requests in dev tools
The most basic way to debug your Adobe Analytics tags is by perusing the Network tab in your browser’s developer tools. This technique will work on any browser but is largely unnecessary considering the availability of free debugging tools to accomplish the same task.
For the sake of illustrating why analysts prefer to use the subsequent techniques over this one, here is the basic process for debugging a network request using your dev tools.
Locating the tag in dev tools
- Open your browser’s developer tools in Chrome, Firefox, or Safari.
- Navigate to the Network tab.
- Initiate the action that should trigger your tag to fire, such as a page load or an interaction event.
- Locate the network request that should result from that event. Finding the request is most difficult the first time. Common ways to find the request are by filtering the list for terms like “adobe” or the subdomain you set up for your tracking server.
If you can’t find any request, go back to your tag manager to evaluate your triggering rules to see why the tag isn’t firing as expected.
Debugging the analytics request
- Select the request and scroll down to the section that says Query Parameters (assuming data is being passed via query parameters and not via POST payload).
- Select “View Decoded” to decode the URL character encoding.
- Locate the variables you want to check and verify those variables are present and contain the values you expect.
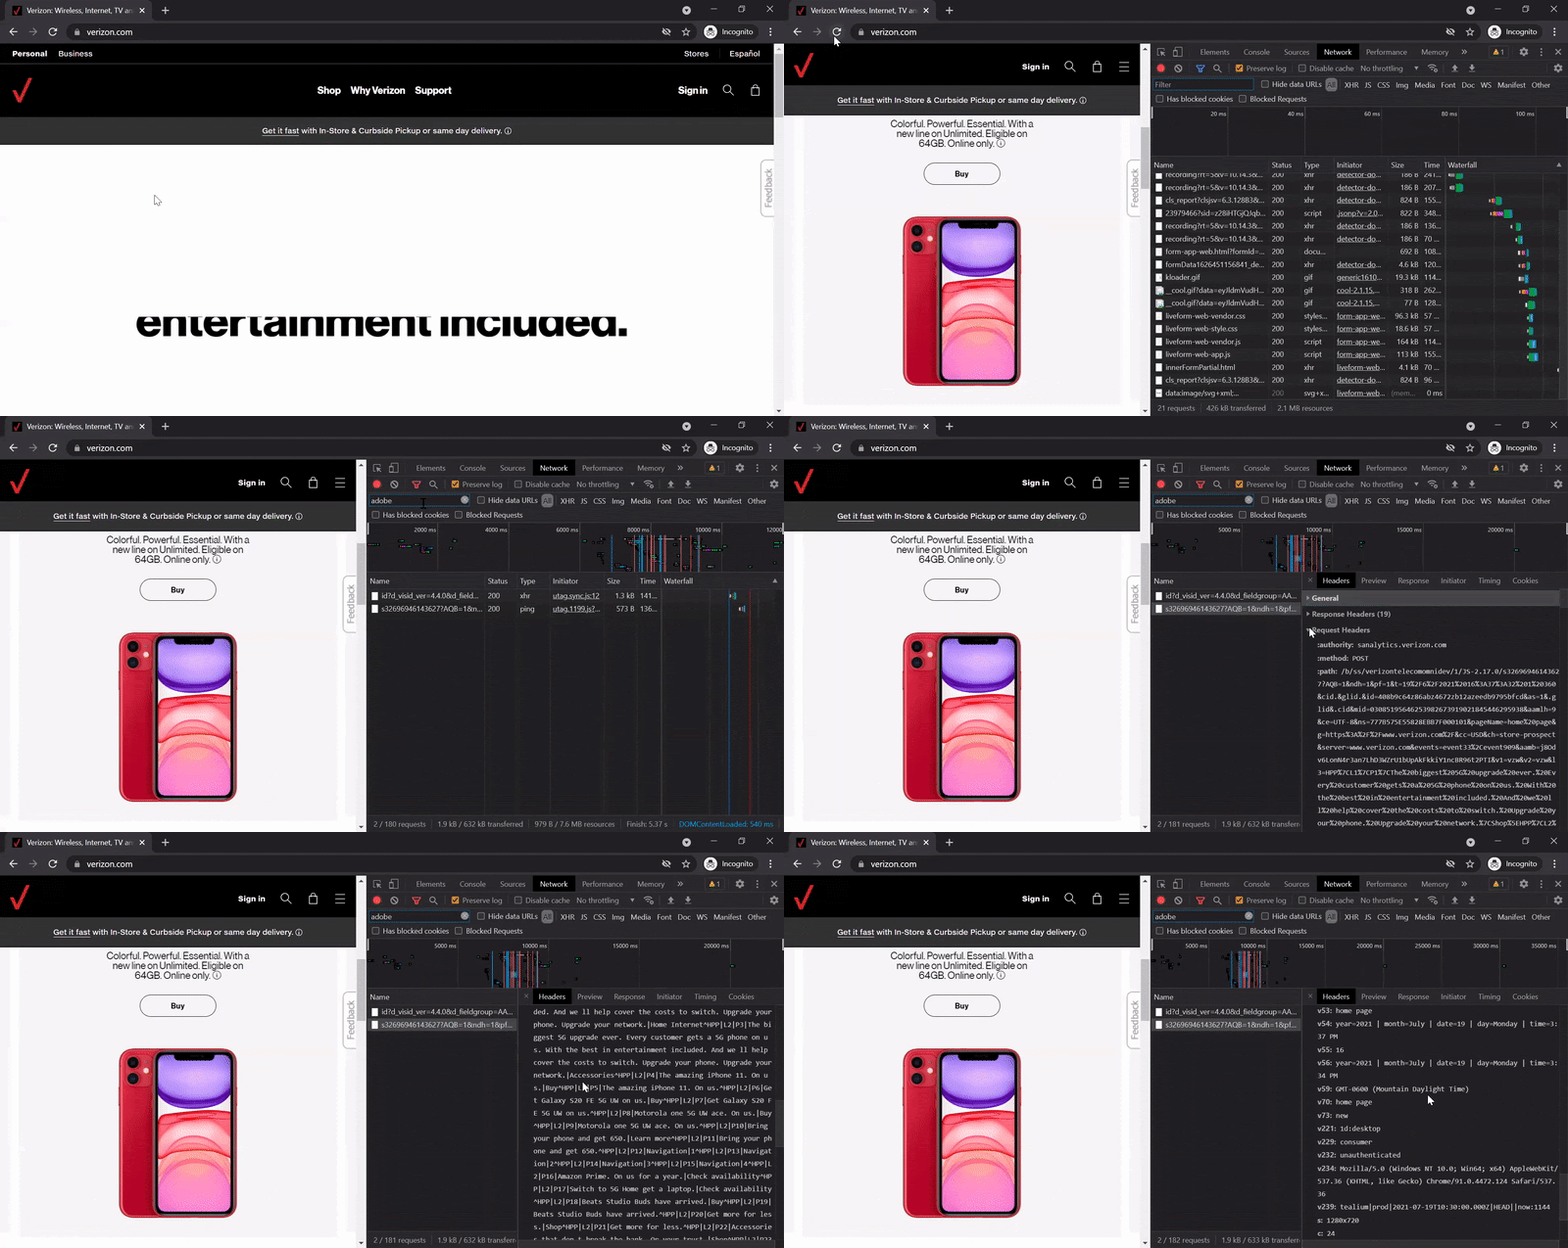
Below is what the full process might look like:

As you can imagine, this process will become highly tedious after even just a few repetitions. Thankfully, you should never have to take this approach, since, at a minimum, you can use an Adobe Analytics debugger to more easily debug individual requests.
2. Using an Adobe Analytics Debugger
ObservePoint’s TagDebugger is a free Google Chrome extension that enables you to debug not only your Adobe Analytics requests but also those of any analytics platform collecting data on your site. You can also see other installed marketing vendors, like social media pixels, marketing automation tags, and more.
After you install the TagDebugger in Chrome, here are the basic steps to use this free tool.
How to use our Adobe Analytics debugger
- Open your Chrome Developer tools.
- Locate and click the new tab that says “ObservePoint.”
- Refresh the page. You should start seeing the tool capture and parse recognized network requests.
- To filter for any Adobe Analytics requests, click the filter button on the Tag Name column and type in “adobe analytics.” You’ll be able to see high-level data about the tag like the Account (i.e. report suite), Category (i.e. analytics), status, and more.
- To see specific variables in the network request, click on the tag you’re interested in. You will then be able to peruse which variables are present in the request, as well as the data contained in each variable.
Here is what that process would look like:

Upgrading from manually reviewing network requests to using a TagDebugger is a powerful leap. Debugging tags this way is perfectly suited for situations where you need to:
- Quickly validate a new update to your site didn’t affect tracking
- Verify a new aspect of your implementation is working correctly
But as much as we love our TagDebugger, it has its limitations. Your site is not just one page that changes occasionally—it’s hundreds if not thousands of pages that change often. Change is the reason analytics implementations break down, and you can’t possibly debug a critical mass of pages every time your website or implementation changes.
Which brings us to the third technique for debugging an analytics implementation.
3. Conducting an Automated Adobe Analytics Audit
Applying the word “debugging” to this final technique is a generous use of the term, considering how powerful an automated audit can be.
While your website will certainly change with time, the analytics data you hope to collect shouldn’t. Yes, you’ll collect more data as your analytics program matures, but once you start collecting data, you want to ensure you continue collecting the same data for the foreseeable future.
An automated Adobe Analytics audit does a few things, including:
- Verify your Adobe Analytics tags are present on each page
- Verify your variables are always present
- Validate each variable has the right data in the right format
The beauty of the audit is that you can configure it to run on a set schedule and notify you if anything is amiss. You’ll save time and rest easy knowing that if something goes wrong, you’ll quickly receive a notification so you can fix the error.
ObservePoint’s Technology Governance platform makes automated audits possible. Learn more about audits in the video below
Ensure Your Adobe Analytics Implementation Is Always Working
You spend a lot of time and money on Adobe Analytics, so you want to ensure you get the best return on your efforts. Regularly debugging and/or auditing your implementation can help you realize the return you’re hoping for.
If you’re interested in seeing the current state of your Adobe Analytics implementation across your site, schedule your free Adobe Analytics audit with an ObservePoint rep.


