
What’s the best way to verify third-party web tags (like Adobe Analytics or Google Analytics) are firing on your site as you expect them to?
The traditional route would be to open the Network tab in your developer tools and debug from there. But your job is already hard enough, so we wanted to make the process a little easier for you.
That’s why we created TagDebugger. TagDebugger is a free plugin for Google Chrome that shows which vendor’s tags are firing on whichever page you’re currently looking at. It even shows how quickly the tag is loading and what variable content is being passed.
Here’s how to install and use our TagDebugger.
Tag Debugging Made Easy
Using the ObservePoint TagDebugger is simple. Here’s how to install and use this freemium tool:
Install, Configure and Open TagDebugger in Chrome
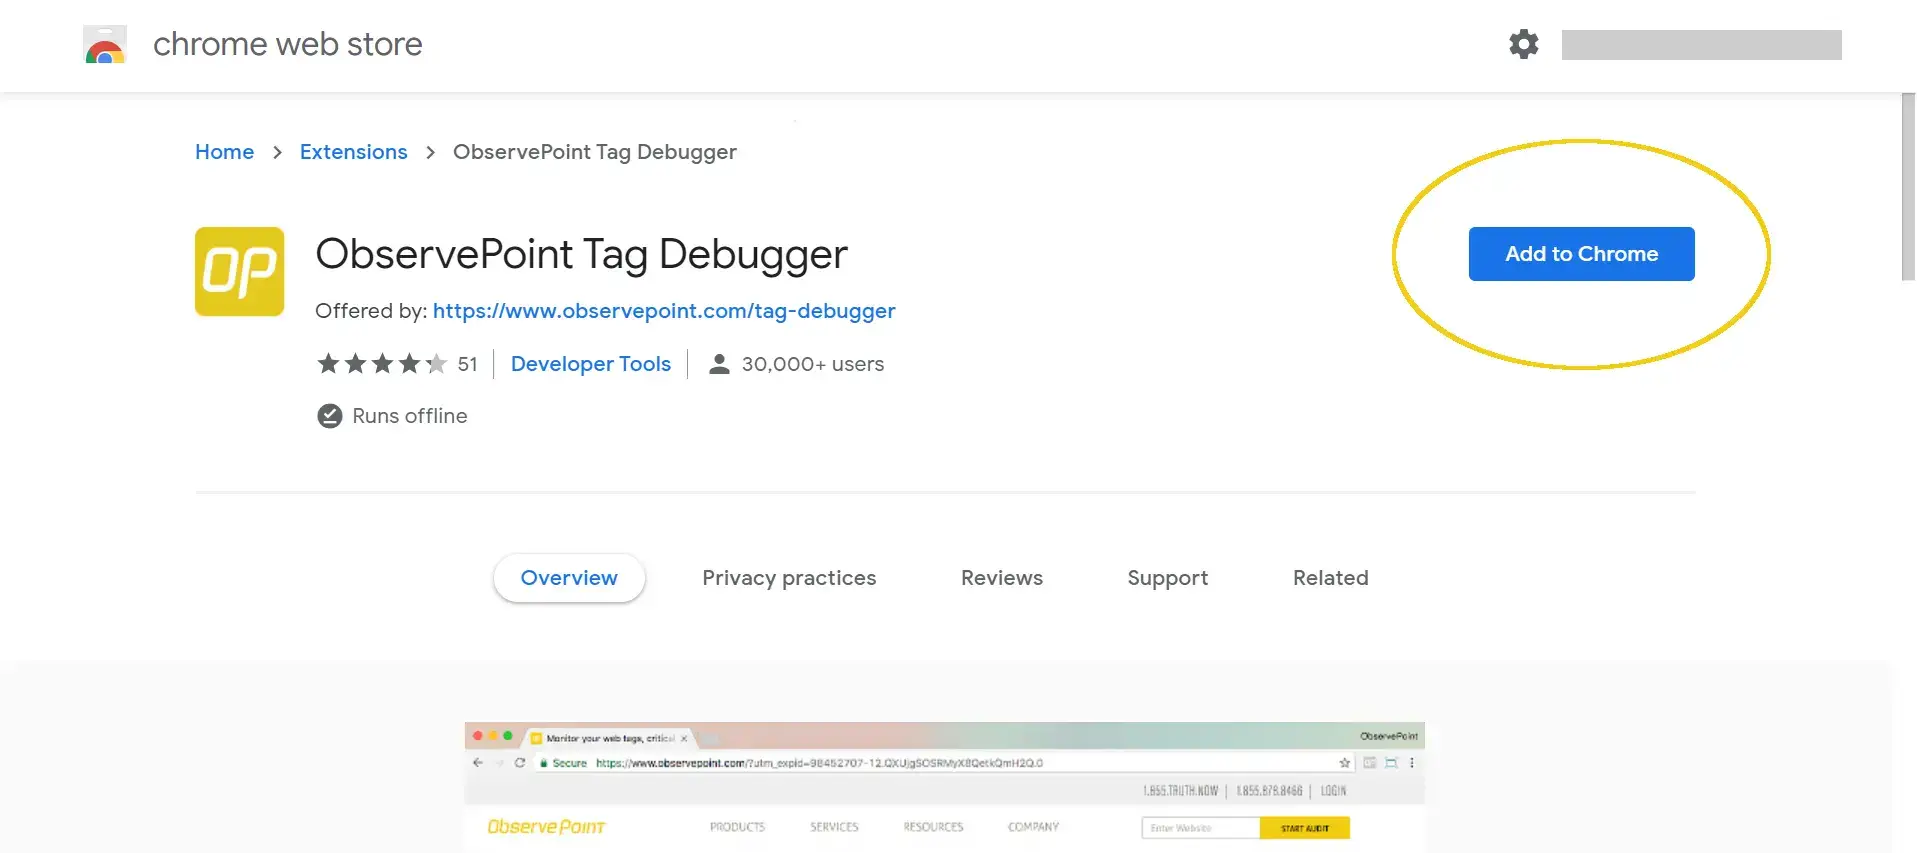
1. Request access to the TagDebugger. After filling out the form, you’ll be redirected to the Chrome Webstore.
2. Install the TagDebugger by clicking “Add to Chrome.”
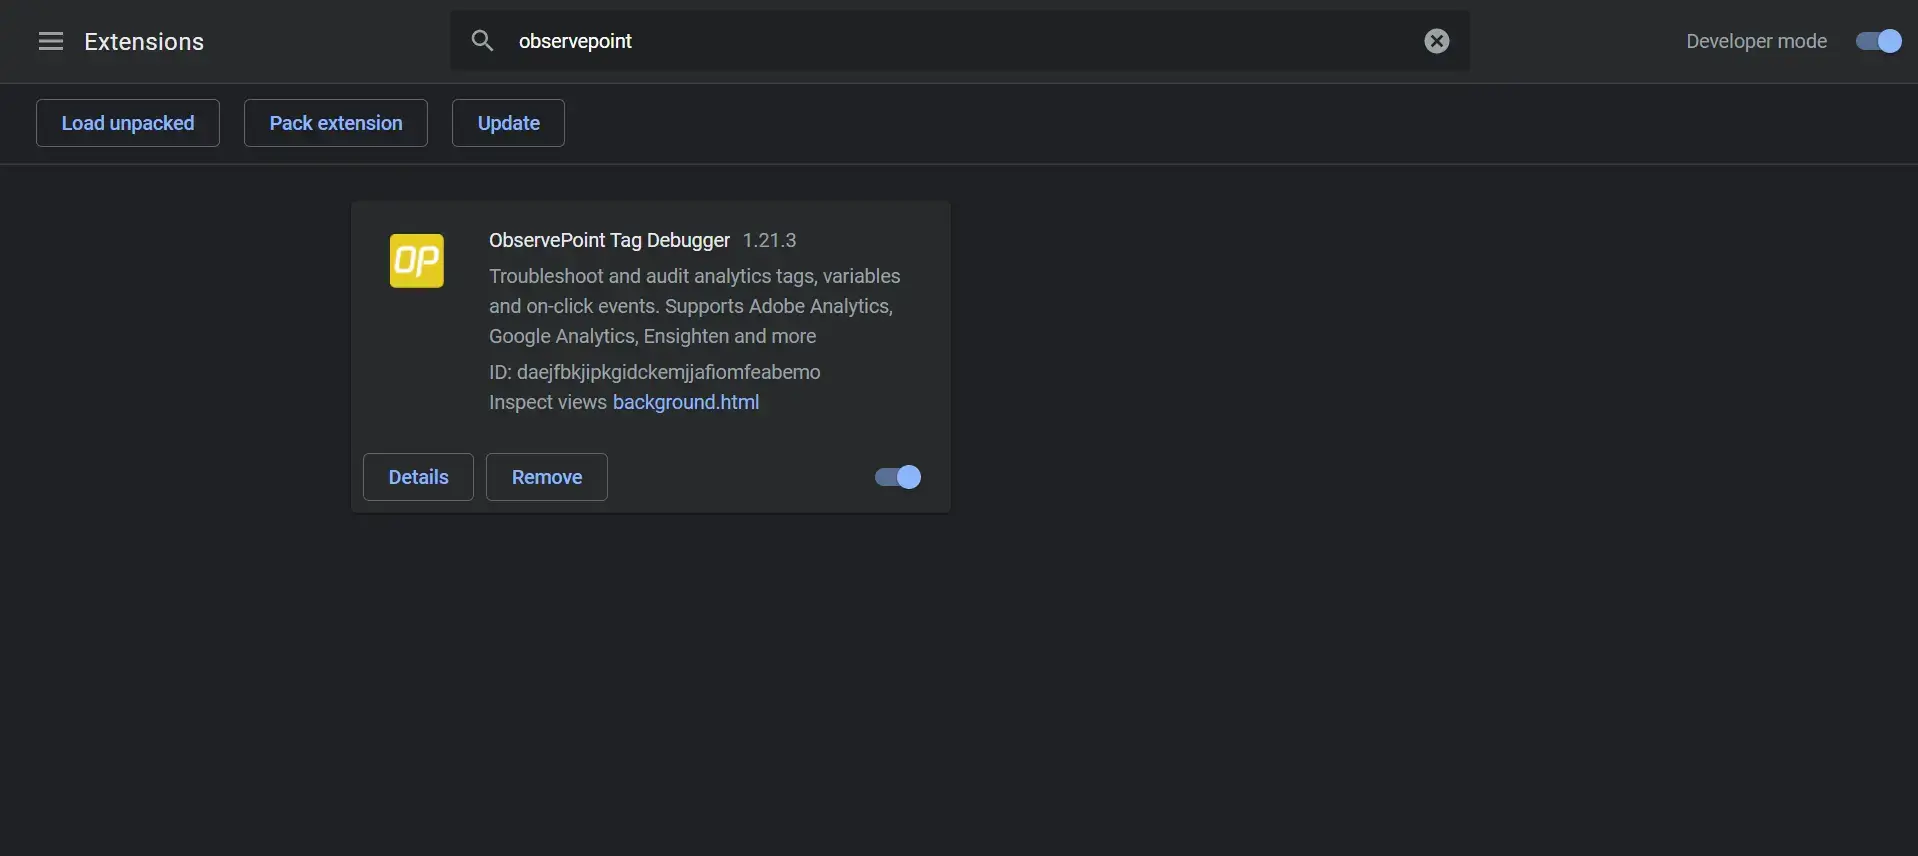
3. Ensure the extension is enabled by navigating to chrome://extensions. Search for “ObservePoint” and verify it is enabled, which it should be by default.
4. Open the Chrome Developer Tools. On Windows and Linux, press Control-Shift-i. On Mac, press Command-Option-i. A drawer should open on the side of your Chrome Browser.
5. Select the ObservePoint panel in the top bar of Developer tools. If this panel is not visible, click on the double arrow and then click on “ObservePoint” in the drop-down.
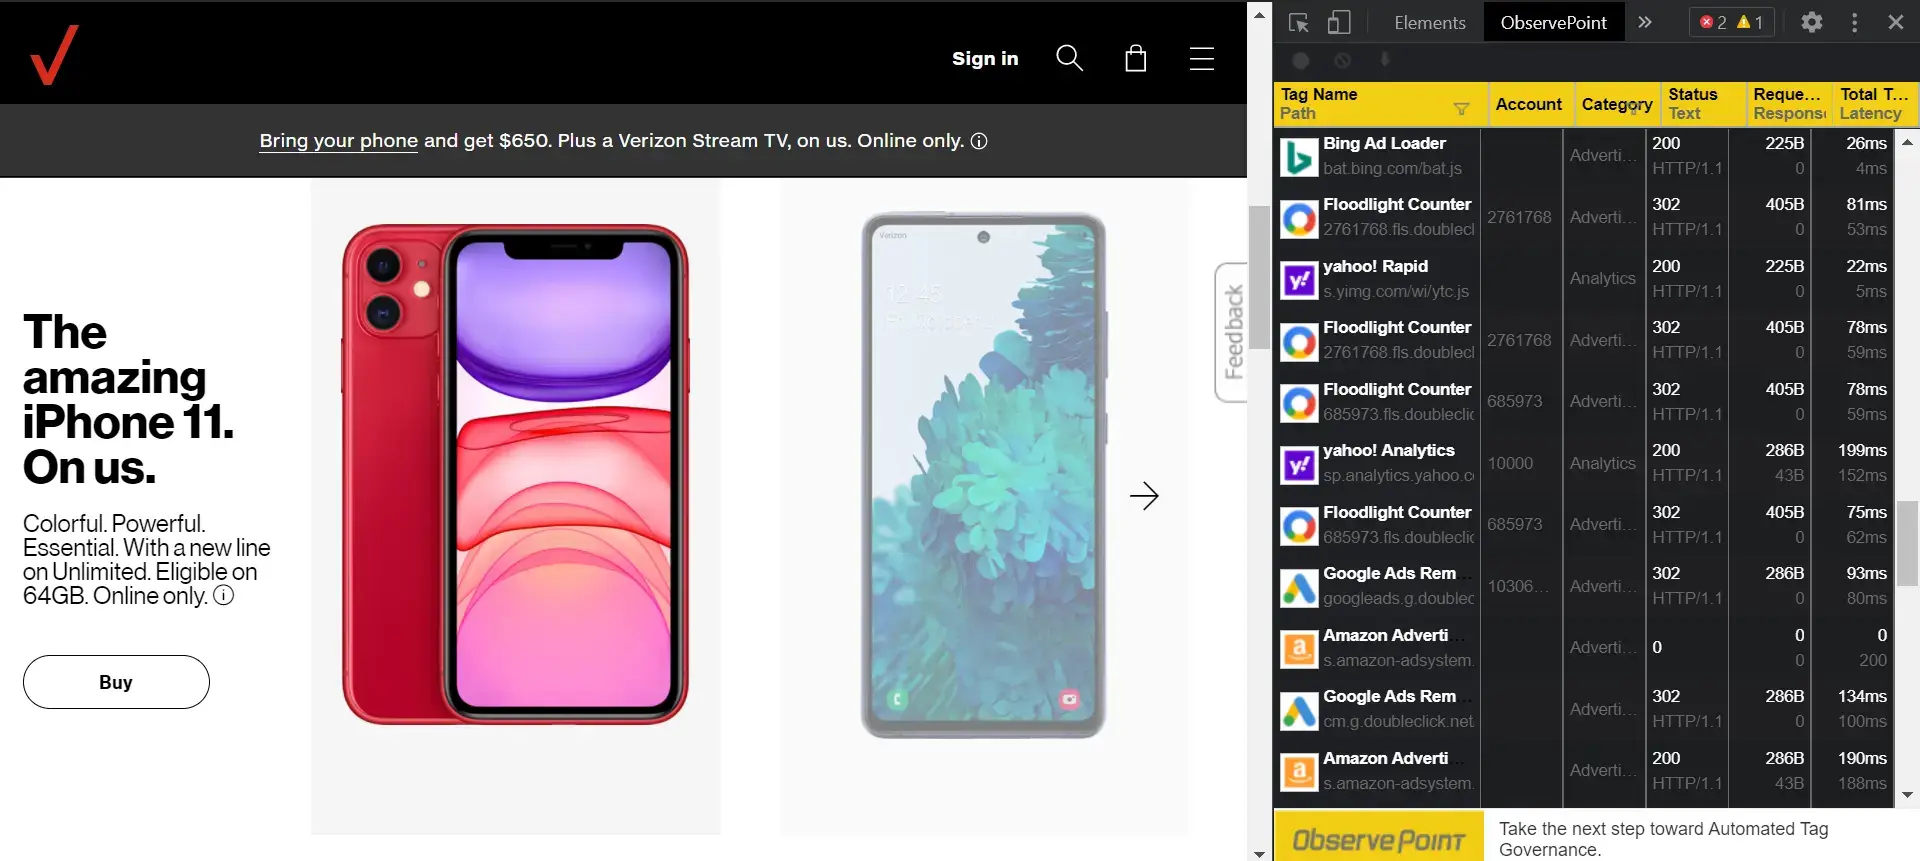
Refresh the page. When you refresh or navigate to a new page, you will see which tags are firing, along with other valuable information, as outlined below. Click on a tag to see more details.
What information does TagDebugger show you?
TagDebugger provides you with some of the most relevant information about your third-party tags, including:
Tag Name / Path: This is the name ObservePoint uses to uniquely identify each vendor and tagging technology. The path is the tag request up to the query string.
Account: The value of this dimension varies from vendor to vendor. This is the Adobe Analytics report suite, Google Analytics profile, Webtrends DCSID, etc. Within ObservePoint we call them accounts.
Category: This is ObservePoint’s classification of the kind of tag listed. Categories include analytics, advertising, tag management, video, voice of consumer, split testing, eCommerce and lead tracking. For a complete list of all tags we support, please visit our tag database.
Status: This is the network status code of the tag request. Most should be status 200 (OK).
Request / Response Size: The request dimension is the amount of data sent to the vendor’s collection servers. The response is the data sent back to your web browser by the vendor.
Total Time / Latency: Total time is measured from the time of the initial request for the tag to the time it is fully loaded. Latency is the time it takes from the initial request to the first response from the vendor.
Using this information, you will be able to identify which tags are firing on a page-by-page basis and determine if they are operating properly.
What’s Next?
TagDebugger is a great tool for quick and easy spot-checks to make sure the right tags are firing on page load or following an event. The only thing TagDebugger isn’t great for is if you want to audit first and third-party web technologies across your entire site.
If you want to level up your ability to verify third-party tech is accurately and securely collecting data, ObservePoint’s Technology Governance platform can automatically scan hundreds of pages on your site, cataloging which tags fire when and what data they’re collecting. You can even set up rules that make sure tags fire at the right time and that the data matches the format you expect.
Watch the short video below to see ObservePoint in action.
Go from manually checking tags to automatically validating them. Learn more about Technology Governance.