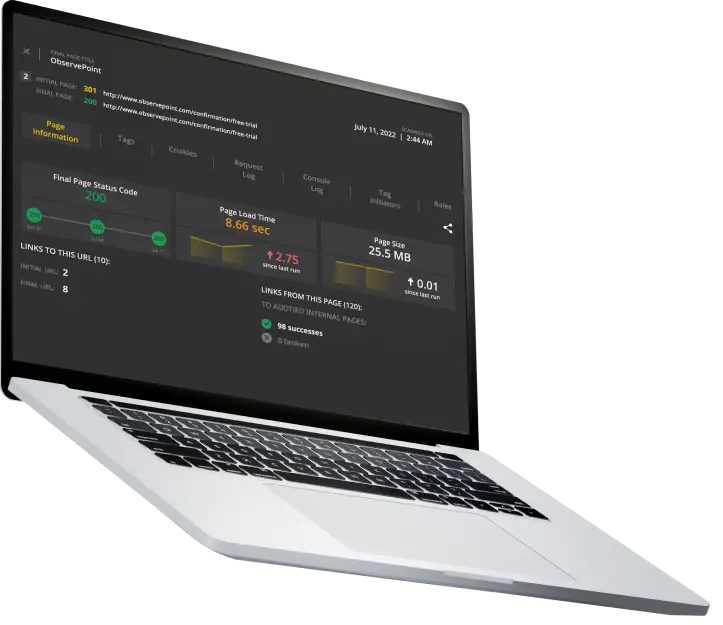
A Google Chrome Extension to Debug Your Tags
ObservePointDebugger is ObservePoint’s free Chrome extension that allows you to quickly debug tags on individual pages. With the ObservePointDebugger plugin, you can view and audit analytics, advertising, VOC, tag management, and media measurement tags and technologies as you browse through pages. You can also inspect the variables for each tag, monitor on-click events, and export your browsing session to Excel.
Debug all major Adobe and Google products and more.
ObservePointDebugger offers select, freemium features of ObservePoint’s full auditing solution, allowing you to manually spot-check right in your browser. ObservePoint’s full platform automates the process across your entire website at scale. This Chrome extension supports all major vendor tags, including Google Tag Manager and Adobe products.
Perform quick tag checks on individual pages.
Inspect the variables for each tag.
Monitor on-click events.
Export your browsing session to Excel.
How do I use the ObservePointDebugger?
- Request access to the ObservePointDebugger.
- Install from the Chrome Webstore.
- Open Chrome’s Developer Tools.
- Open the ObservePoint panel.
- Reload the page to see tags load.
Which tags/marketing vendors does the ObservePointDebugger support?
ObservePointDebugger recognizes thousands of tags from across the martech landscape.
Adobe Analytics
Adobe Target
Adobe Launch
Adobe DTM
Adobe DigitalPulse
Google Tag Manager
Google Analytics
Google Ads
Other popular marketing vendors you can debug
Tealium
Ensighten
Facebook
OneTrust
Marketo
Can ObservePointDebugger be used as an Adobe Analytics debugger?
Yes. The ObservePointDebugger Chrome extension recognizes all Adobe products in the Adobe Experience or Marketing Cloud, capturing the details of any data collection and parsing the data into a human readable format for easy debugging. For Adobe Analytics, the ObservePointDebugger can parse both GET and POST requests.
How can ObservePointDebugger help debug Google Tag Manager (GTM), Google Analytics (GA), and other Google products?
The ObservePointDebugger Chrome extension works as a debugger for Google Analytics, Google Tag Manager, and other Google products.
With the ObservePointDebugger plugin, you can verify that your Google Tag Manager container code is present on individual pages, as well as check Google Analytics tags (both page-load and event-triggered tags) are firing as expected. Other tags, like Google Ads, are also supported.
Can the ObservePointDebugger debug analytics tags from all vendors?
Yes. ObservePoint’s ObservePointDebugger recognizes tags of all major web analytics vendors. When a tag fires, ObservePointDebugger captures the data collection and parses it into a human readable format for easy debugging.
Can the ObservePointDebugger debug the data layer?
Yes. ObservePointDebugger supports data layer debugging. Simply define your data layer object name in the extensions options then begin a debugging session. As you debug, your data layer will appear as another item in the list of tags.
What are some alternative Chrome extensions like ObservePointDebugger?


Who is ObservePoint?
ObservePoint’s web governance platform brings insights, automation, and compliance to the complexity of your digital customer experience. ObservePoint’s patented web governance solution automatically scans your web pages, data collection technologies, and user paths. Monitor and test the implementation of your site analytics, data privacy programs, and the functionality of key customer experiences with your brand.
